CS Fire Monitor
For
Windows 2000, Windows XP. Windows 2003, Windows Vista & Windows 2008
Help File V3
Based on CS Fire Monitor V 2.5.0
Index
CS Fire Monitor is a comprehensive
monitoring tool for the Windows 2000, Windows XP, Windows 2003, WIndows Vista & WIndows 2008 platforms. It
has an extensive range of live monitoring screens that capture data from many
areas within a PC and since the application has its own inbuilt database it is also
capable of producing a number of reports which can be saved in a variety of
ways. In addition, the Remote Viewer allows the user to access other PCs on the
same LAN or over the Internet to extract key information. The application is
highly configurable and incorporates several methods of monitoring the same
information so that each user can choose the most appropriate method to meet
their needs.
Navigation
CS Fire Monitor, once installed, can be
opened by any of the following methods:
-
Start Menu->All Programs->CS Fire
Monitor->CS Fire Monitor
-
Double click the CS Fire Monitor Icon on
the Desktop if one exists
-
Double click the CS Fire Monitor Icon in the
System Tray if one exists
-
Right Click the CS Fire Monitor Icon in the
System Tray if one exists and select “Show CS Fire Monitor”
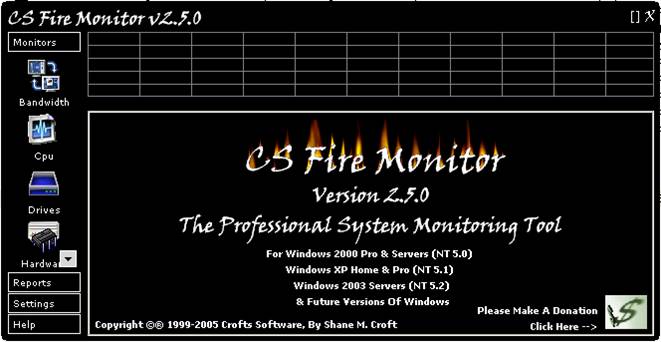
Figure
1
Figure 1 above shows the initial CS Fire
Monitor welcome screen. There is a Navigation Bar on the left hand side that
allows access to all areas of the application with the exception of the Remote
Viewer which is accessed via its own Desktop shortcut and will be explained
later. Each of the main application groups is highlighted by a boxed heading and
clicking on the heading expands to show the items within that group. Clicking
on an item within a group highlights the selected item with a box and shows the
relevant screen to the right replacing the welcome screen. The [ ] at
the top right hand side of the CS Fire Monitor window maximises the application
to full screen size whilst the X closes the application back to
the System Tray.
Monitors
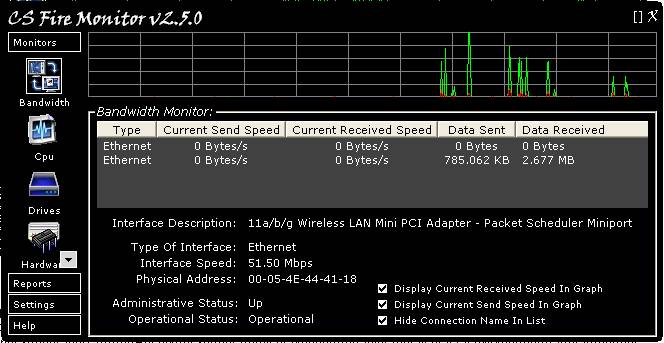
Figure
2
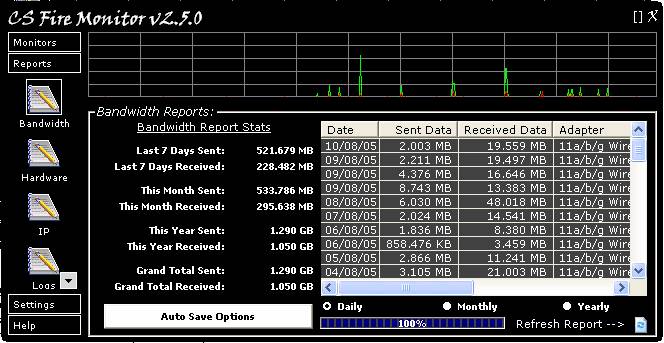
Figure 2 above shows the Bandwidth Monitor
screen. The Bandwidth Monitor table in the middle of the screen detects all
connections on the PC and monitors the amount of data going to and from each
connection. Current Send Speed and Current Received Speed are displayed in the
table and also as activity in the graph at the top of the screen. The vertical
axis of the graph is scaled according to settings within
Settings->Bandwidth. The activity on the graph is stepping from right to
left with each horizontal graduation representing about one (1) minute in time.
Double clicking the graph expands it vertically to show more detail; double
clicking again returns the graph to the original size. Right clicking the graph
displays a menu allowing the graph to be cleared or saved as a bit map.
The total volume of Data Sent and Data
Received for each connection is also recorded and stored in the CS Fire Monitor
database so that reports can be generated for Data Sent and Data Received during
the current Day, over the Last 7 Days, during the current Month and the current
Year.
Clicking on the line for a particular connection
in the Bandwidth Monitor table will provide the information shown in the lower
half of the screen for that interface adaptor. The first two tick boxes in the
bottom right hand corner of the screen allow the user to select whether to show
Received Speed, Send Speed or both in the graph and the last tick box allows
the Connection Name to be shown or hidden in the table.
Figure
3
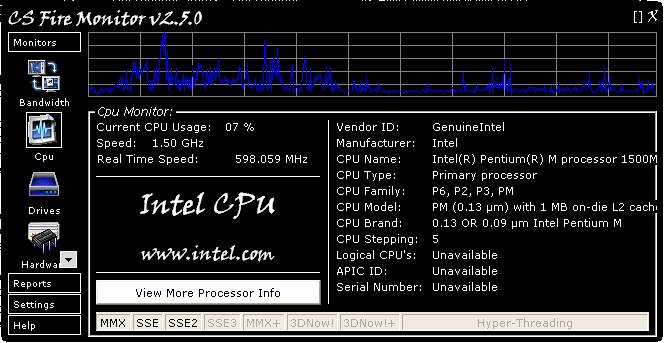
Figure 3 above shows the CPU Monitor
screen. The CPU Monitor detects the current CPU usage of the PC and produces
this as a graph at the top of the screen. Each vertical graduation represents
20% of CPU usage. The graph is stepping from right to left with each horizontal
graduation representing about one (1) minute in time. Double clicking the graph
expands it vertically to show more detail; double clicking again returns the
graph to the original size. Right clicking the graph displays a menu allowing
the graph to be cleared or saved as a bit map. The CPU Monitor also detects the
Real Time Speed of the CPU utilising a real time clock as part of the monitor. A
lot of other useful information is gathered about the installed CPU. Clicking
on “View More Processor Info” reveals another screen shown in Figure 4 below.
Figure
4
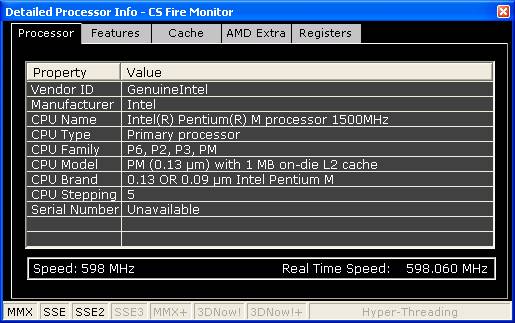
The screen in Figure 4 above has additional
tabs that can be selected to reveal CPU Features, Cache and Registers. An
additional tab for AMD processors shows Power Management and Address Bit
information.
Figure
5
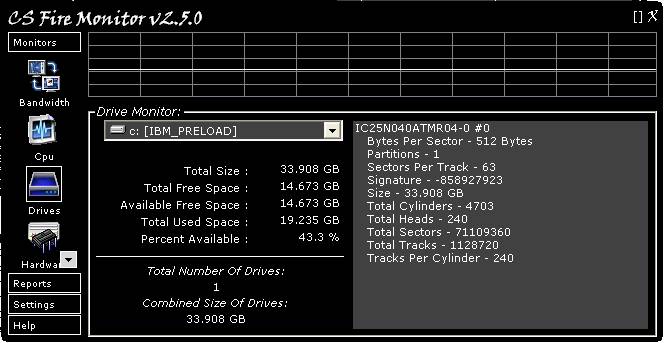
Figure 5 above shows the Drives Monitor
screen. The Drives Monitor shows the amount of used and free space of the hard
drive selected in the drop down list. It gives detailed information for each
hard drive and shows total capacity of all hard drives combined. The percent
available space is also graphed at the top of the screen. Each vertical
graduation represents 20% of available drive space. The graph is stepping from
right to left with each horizontal graduation representing about one (1) minute
in time. Double clicking the graph expands it vertically to show more detail;
double clicking again returns the graph to the original size. Right clicking
the graph displays a menu allowing the graph to be cleared or saved as a bit
map.
Figure
6
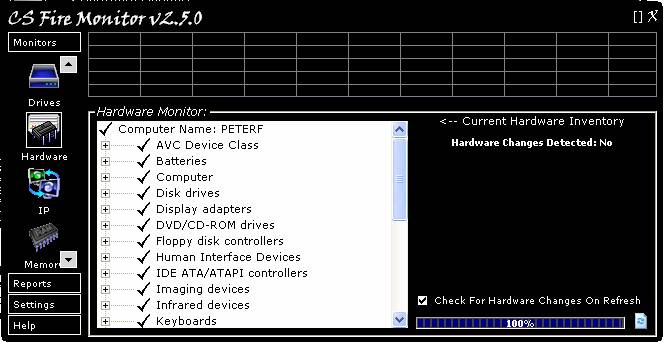
Figure 6 above shows the Hardware Monitor
screen. The Hardware Monitor shows all hardware ever installed on the PC that
Windows has managed to track. The user may see old hardware that is no longer
installed but has not been formally uninstalled through Windows. The monitor also
tracks any hardware that has been added or removed. It will then store the
changes in the CS Fire Monitor database for future reports. The screen can be
refreshed by clicking on the refresh button at the very bottom right hand
corner. If the user wants to check for and list any hardware changes to be
shown on the right hand side of the screen then tick the “Check For Hardware
Changes On Refresh” tick box.


Figure
7
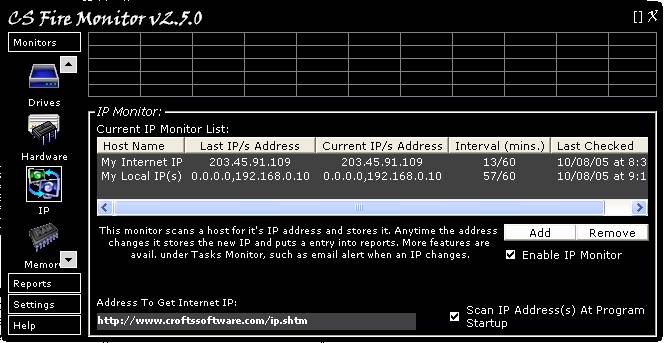
Figure 7 above shows the IP Monitor screen.
The IP Monitor displays Internet IP and/or Local IP addresses. If and when any
IP address changes it stores this information in the CS Fire Monitor database.
Also the user can enable the email feature within Monitors->Tasks->IP to
email themselves or a group of email addresses when the IP address changes and to
include the new IP address in the email.
The Add and Remove buttons on the right
hand side beneath the table allow the user to edit the table contents. Clicking
the table headings will change the list sort order based on that particular
information. The “Enable IP Monitor” tick box must be ticked to allow CS Fire
Monitor to carry out regular checking of all IP addresses. The “Scan IP
Address(es) At Program Startup” tick box can be ticked to make sure that an IP scan
is carried out at program startup irrespective of when the next regular scan of
IP addresses was to be made.
The “Address To Get Internet IP” field at
the bottom left hand corner of the screen specifies the location where CS Fire
Monitor obtains “My Internet IP” address from as this must be obtained from an
external connection.
Figure
8
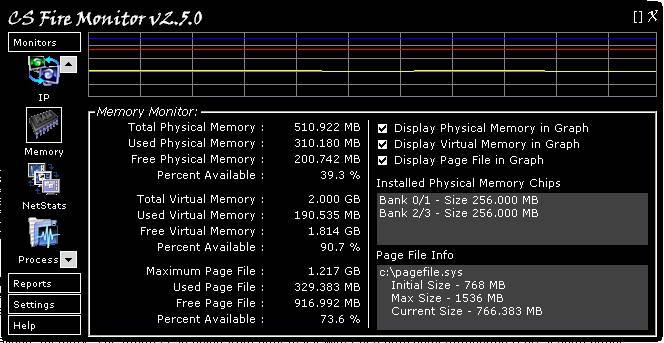
Figure 8 above shows the Memory Monitor
screen. The Memory Monitor displays Physical Memory, Virtual Memory, and Page
File statistics. Also shown are the physical memory chips installed and the location
and size of each of these. The set of three tick boxes under the graph on the
right hand side allows the user to select which of Physical, Virtual and/or
Page File are shown in the graph. Each vertical graduation represents 20% of
available memory. The graph is stepping from right to left with each horizontal
graduation representing about one (1) minute in time. Double clicking the graph
expands it vertically to show more detail; double clicking again returns the
graph to the original size. Right clicking the graph displays a menu allowing
the graph to be cleared or saved as a bit map.
Figure
9
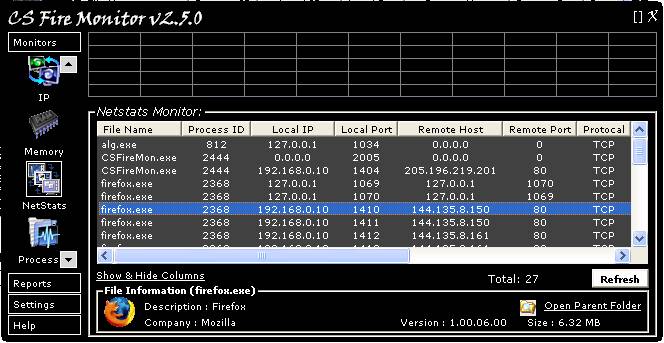
Figure 9 above shows the NetStats Monitor
screen. This screen only works on Windows XP and 2003 or newer. If there is no
information shown in the Monitor initially, just click on the “Refresh” button
at the bottom right hand corner of the table. The screen shows all current
network connections on the PC and also which programs are making those
connections. This facility uses an undocumented API call that is only available
from Windows XP and above.
When using the NetStats Monitor it is handy
to click on the [ ] symbol at the top right hand corner of the screen to
enlarge the window to full size as this generally saves using the scroll bars. Clicking
the table headings will change the list sort order based on that particular
information. To show or hide table columns, click on the link “Show & Hide
Columns” at the bottom left hand corner of the table. If you click on a
particular line in the table it will be highlighted in blue and more
information about that particular program will be shown at the bottom of the
screen under the heading “File Information”. Clicking on the “Open Parent
Folder” link will open Windows Explorer in the relevant program folder. Right
clicking anywhere within the table will give options for saving the table of
information.
Figure
10
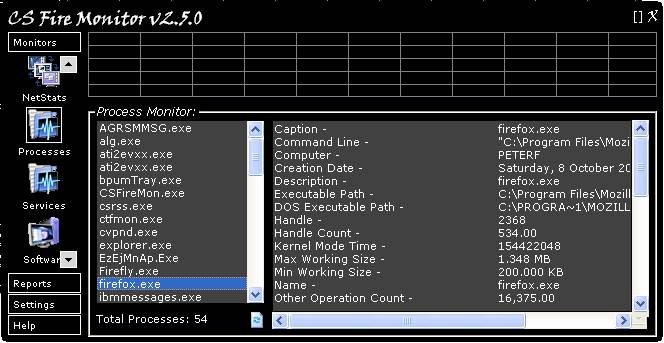
Figure 10 above shows the Process Monitor
screen. This screen shows all running processes and, by clicking on a
particular process in the left had panel, detailed process information is shown
in the right hand panel. When using the Process Monitor it is handy to click on
the [ ] symbol at the top right hand corner of the screen to enlarge the
window to full size as this generally saves using the scroll bars. Right
clicking on any particular process in the left had panel brings up a menu that
allows the user to, amongst other things, End or set the Priority of the
process.
Figure
11
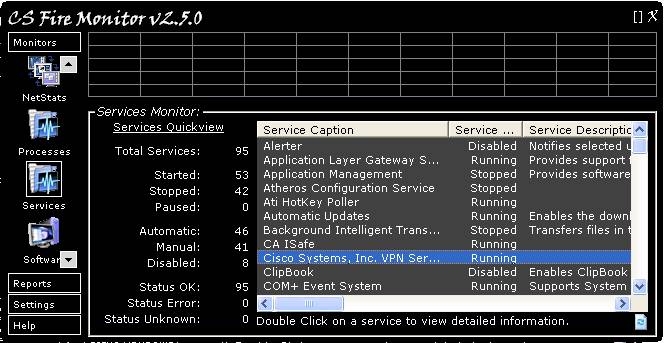
Figure 11 above shows the Services Monitor
screen. This screen shows all services running on the PC. When using the
Services Monitor it is handy to click on the [ ] symbol at the top right
hand corner of the screen to enlarge the window to full size as this generally
saves using the scroll bars. To refresh the Services Monitor click the “Refresh”
button at the bottom right hand corner of the screen. Clicking the table
headings will change the list sort order based on that particular information.
Double clicking a particular process will open a supplementary screen with more
details of that process as illustrated in Figure 12 below.
Figure
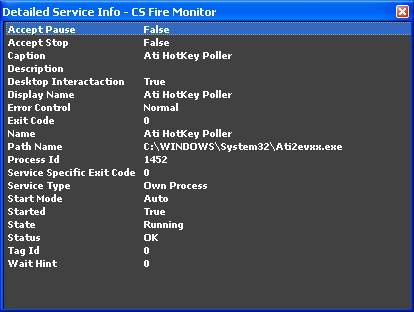
12
Right clicking on any particular service in
the Services Monitor screen brings up a menu that allows the user to, amongst
other things, Start, Stop, Pause or Resume a service or change the Startup mode.
Figure
13
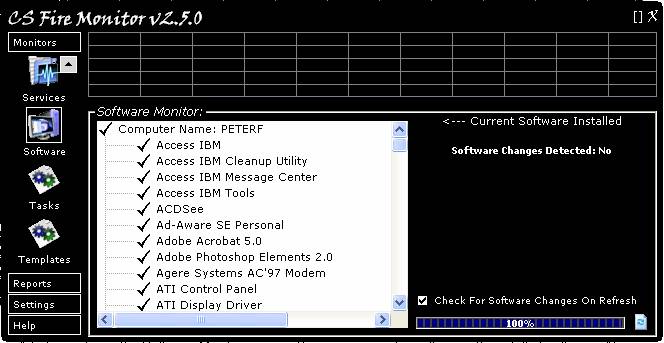
Figure 13 above shows the Software Monitor
screen. This screen monitors all currently installed software. Also the
Software Monitor tracks any software that has been added or removed. It will
then store the changes in the CS Fire Monitor database for future reports. To
refresh the monitor just click on the “Refresh” button at the bottom right hand
corner of the screen. If the user wants to check for and list any software
changes to be shown on the right hand side of the screen then tick the “Check
For Software Changes On Refresh” tick box.
Figure
14
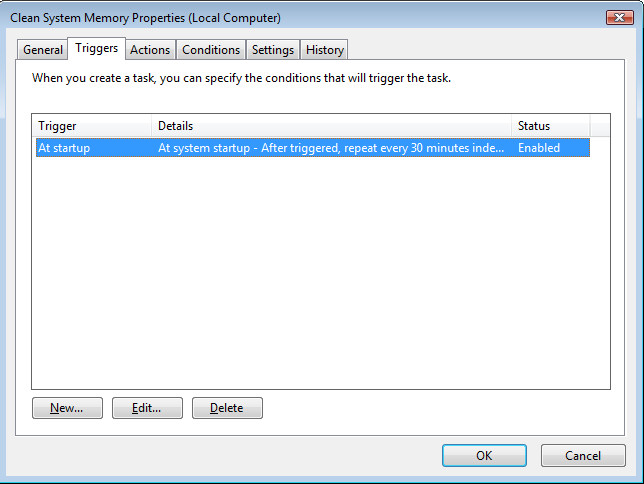
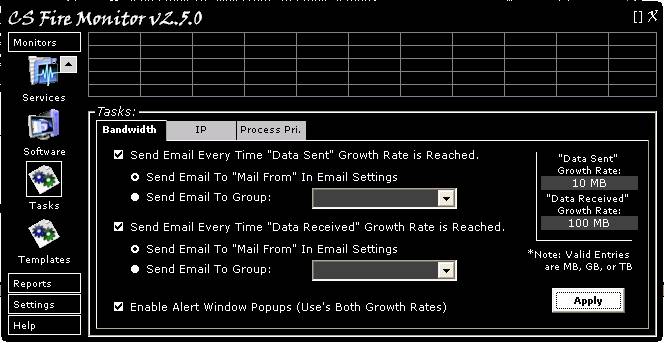
Figure 14 above shows the Tasks Monitor
screen. This screen allows the user to set up a number of Tasks that can be
carried out when certain events are detected by CS Fire Monitor. There are
three (3) tabbed screens; the first called “Bandwidth” (shown in Figure 14) and
two more called “IP” and “Process Priority”.
The “Bandwidth” tab allows the user to
email themselves or a group of email addresses each time that the total “Data
Sent” exceeds a preset increment as defined in the field at the top right hand
corner of the screen (10 MB in the example shown). To activate, the tick box
must be ticked and the radio button set for the appropriate email to be sent to
themselves or a group of email addresses. Similarly, each time the total “Data
Received” exceeds a preset increment as defined in the second field at the top
right hand corner of the screen (100 MB in the example shown).
In addition, Alert Window Popups (appearing
above the System Tray) can be activated when either of the preset Data increments
is exceeded. This is achieved by ticking the tick box at the bottom of the
screen. After all the above settings have been made, click the “Apply” button
at the bottom right hand corner of the screen.
Figure
15
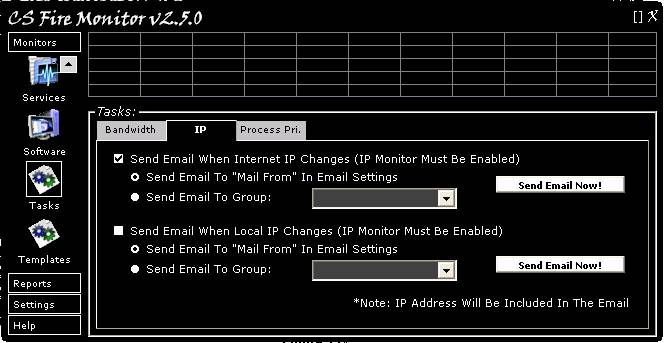
Figure 15 above shows the “IP” tab in the
Tasks Monitor screen. The IP tab allows the user to email themselves or a group
of email addresses each time that any Internet IP or Local IP address changes.
To activate either, the tick box must be ticked and the radio button set for
the appropriate email to be sent. Test emails can be sent by clicking on the
“Send Email Now!” buttons.
Figure
16
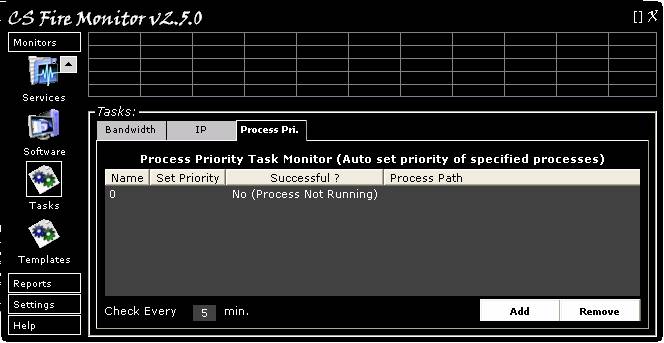
Figure 16 above shows the “Process
Priority” tab in the Tasks Monitor screen. The user can add and remove programs
for which the priority can be pre-determined by clicking on the “Add” and
“Remove” buttons at the bottom right hand corner of the screen. The “Add”
button opens a screen as shown below in Figure 17.
Figure
17
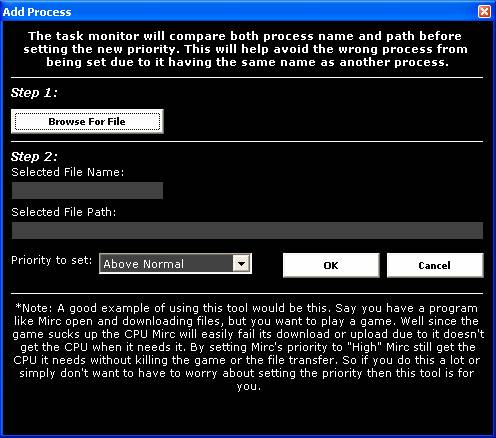
The screen in Figure 17 above allows the
user to select a program and preset the priority. The “Remove” button on the
main screen (Figure 16) allows a highlighted program in the table to be
removed. The time interval in the “Check Every” field can also be adjusted by
the user.
Figure
18
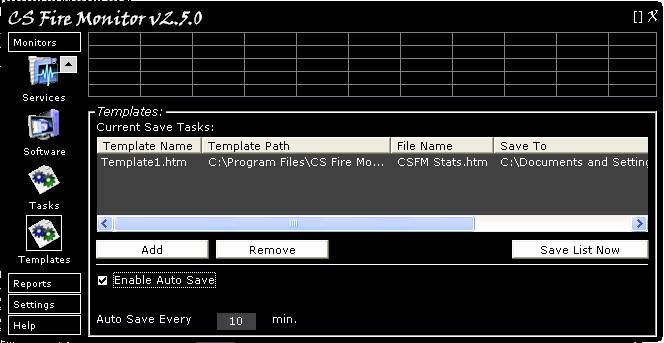
Figure 18 above shows the Template Monitor
screen. This screen allows various reports to be listed so that they can be
either saved as and when required, by clicking on the “Save List Now” button,
or on a regular basis by ticking the “Enable Auto Save” tickbox and setting an
appropriate time interval in the “Auto Save Every” field. If the user wants to
refresh the information for each report before saving, then the “Auto Refresh
Reports” should also be ticked.
Templates work by CS Fire Monitor loading
the nominated template and reading the template for keywords. Once a keyword is
found the keyword is replaced with the current data equivalent to that keyword.
Text in the template and the data information required are then saved to the
output file. The user can make up their own templates and place them in the “templates”
folder within the CS Fire Monitor program folder. The user can find and open
the file “Template1.htm” in the “templates” folder within the CS Fire Monitor
program folder and get the idea. Templates do not have to be “htm” files; they
can be just plain “txt” files if that is simpler. The keywords for templates
are listed in the Appendix at the end of this Help File.
Clicking on the “Add” button brings up the
screen shown in Figure 19 below.
Figure
19
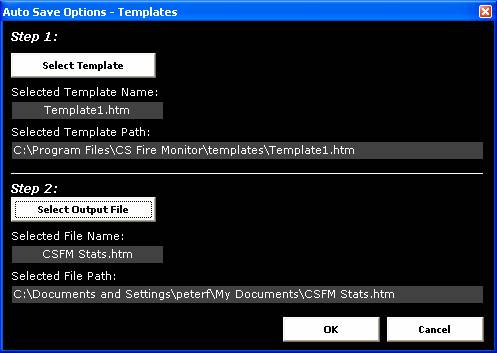
Figure 19 above shows the screen for
selecting report templates and specifying output file locations. First click on
the “Select Template” button which allows selection of an appropriate template
from the “templates” folder within the CS Fire Monitor program folder and then
click on the “Select Output File” which allows the user to nominate an output
file name and the destination for that file. Each time a save or “Auto Save”
action occurs the existing output file of the same name is written over with
the updated information.
Reports
Figure
20
Figure 20 above shows the Bandwidth Report
screen. When using the Bandwidth Report it is handy to click on the [ ]
symbol at the top right hand corner of the screen to enlarge the window to full
size as this generally saves using the scroll bars. Clicking table headings
will change the list sort order based on that particular information. An added
feature in this particular report is that the Date sort order is remembered
from one access to the next so that it is always displayed the same way. Right
clicking anywhere within the table will bring up a menu allowing the
information to be saved in a variety of formats.
The option of displaying Sent Data and
Received Data on the basis of Daily, Monthly or Yearly is set by the row of
radio buttons just under the table. If the selection is changed then it is
necessary to refresh the report by clicking on the “Refresh Report” button at
the bottom right hand corner of the screen.
This key report has its own set of auto save
options accessed via the “Auto Save Options” button at the bottom left of the
screen. Clicking on this button opens the screen shown in Figure 21 below.
Figure
21
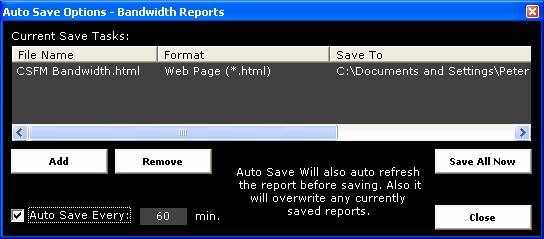
Figure 21 above shows the Auto Save Options
screen for the Bandwidth Report. A new report can be created by using the “Add”
button to open the screen shown in Figure 22 below.
Figure
22
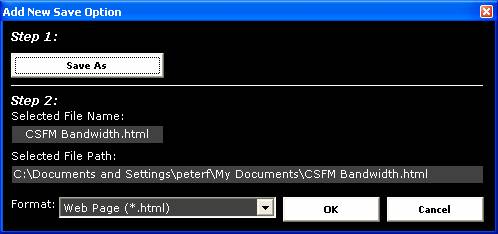
Figure 22 above shows the “Add New Save
Option” screen for the Bandwidth Report. Clicking on “Save As” allows the user
to nominate a file name and specify a location for the Bandwidth Report. The
file format can also be specified at that time (using the “Save as type” drop
down list) or separately by using the “Format” field at the bottom of the
screen shown in Figure 22. Note that the template for the Bandwidth Report is
preset in CS Fire Monitor so there is no need for the user to select a
template. Once all settings have been made click on the “OK” button and the new
File Name, Format and Save To information should be listed in the screen shown
in Figure 21 above. Unnecessary or old reports can be removed by highlighting
them in the table and clicking on the “Remove” button.
The Bandwidth Report(s) can be saved on
demand by clicking the “Save All Now” button on the screen shown in Figure 21
or alternatively the Auto Save function can regularly save the Bandwidth Report
by ticking the box in the bottom left hand corner and selecting an appropriate
time interval in the “Auto Save Every” field. Note that previous Bandwidth
Reports will be overwritten every time a new report with updated information is
saved.
Figure
23
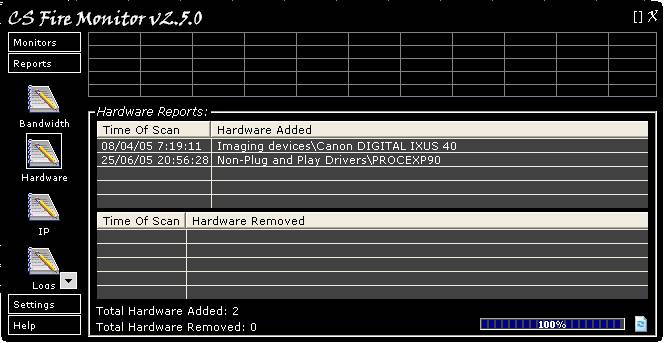
Figure 23 above shows the Hardware Report
screen. This Report shows the date and time when any new hardware was installed
or when any hardware was removed. The Report can be refreshed by clicking on
the “Refresh” button at the bottom right hand corner of the screen. Right
clicking anywhere within the table will bring up a menu allowing the
information to be saved in a variety of formats.
Figure
24
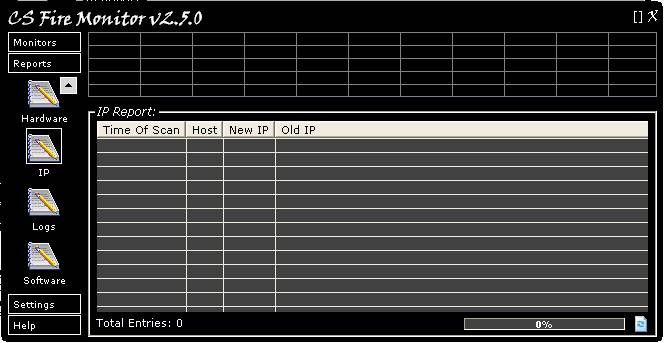
Figure 24 above shows the IP Report screen.
This Report shows the date and time when there was a change to either the
Internet or Local IP address. The Report can be refreshed by clicking on the
“Refresh” button at the bottom right hand corner of the screen. Right clicking
anywhere within the table will bring up a menu allowing the information to be
saved in a variety of formats.
Figure
25
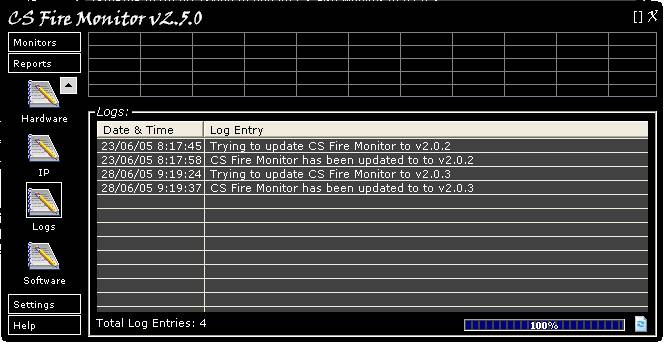
Figure 25 above shows the Logs Report
screen. This Report shows the date and time when there was any change to the CS
Fire Monitor program. The Report can be refreshed by clicking on the “Refresh”
button at the bottom right hand corner of the screen. Right clicking anywhere
within the table will bring up a menu allowing the information to be saved in a
variety of formats.
Figure
26
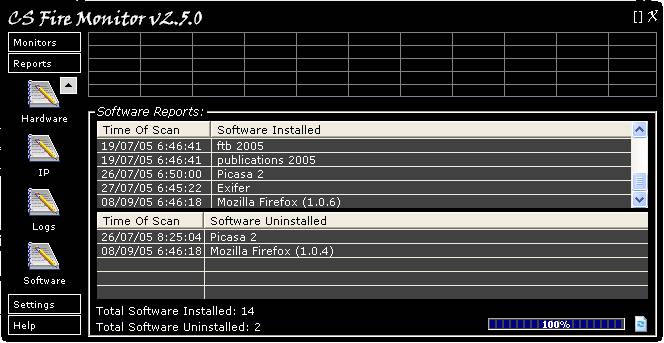
Figure 26 above shows the Software Report
screen. This Report shows the date and time when any new software was installed
or when any software was removed. The Report can be refreshed by clicking on
the “Refresh” button at the bottom right hand corner of the screen. Right
clicking anywhere within the table will bring up a menu allowing the
information to be saved in a variety of formats.
Settings
Figure
27
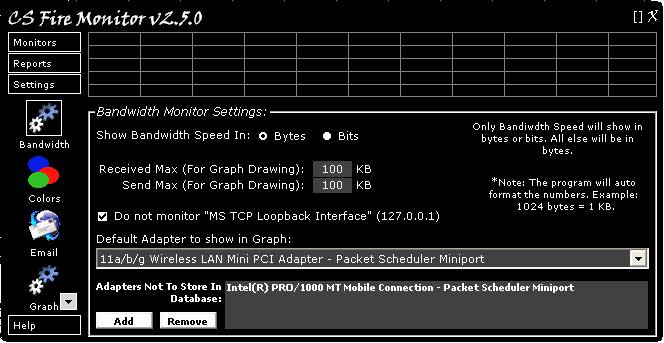
Figure 27 above shows the Bandwidth
Settings screen. The first option is for the setting of Bandwidth Speed in bytes
per second or bits per second. Note that only Bandwidth Speed has this
optional setting; all data volumes are in bytes. The fields labelled “Received
Max” and “Send Max” relate to the vertical axis scale of the graph showing
Bandwidth Speed in the Bandwidth Monitor. Note these entries are in kilobytes
per second. The next tickbox allows the user to ignore the “MS TCP Loopback
Interface”; the default is that this interface is ignored. The drop down list
allows the user to select which interface connection is shown as default in the
Bandwidth Speed graph in the Bandwidth Monitor.
The “Add” and “Remove” buttons at the
bottom of the screen allow the user to select connection interfaces for which
data does not need to be collected in the CS Fire Monitor database and hence
not to be shown in any of the reports. This enables blank lines corresponding
to unused connection interfaces to be eliminated from reports. Clicking on the
“Add” button brings up the screen shown in Figure 28 below.
Figure
28
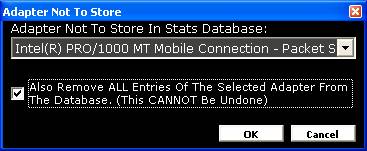
Figure 28 above shows the Adaptor Not to
Store screen. The user can click on the drop down list and select an adaptor to
be excluded from the data gathering process. If already collected data from
this adaptor needs to be eliminated from the database then place a tick in the
tickbox. When “OK” is clicked the adaptor will be listed in the field at the
bottom right hand side of Figure 27. Adaptors can be removed from this list by
highlighting and clicking the “Remove” button.
Figure
29
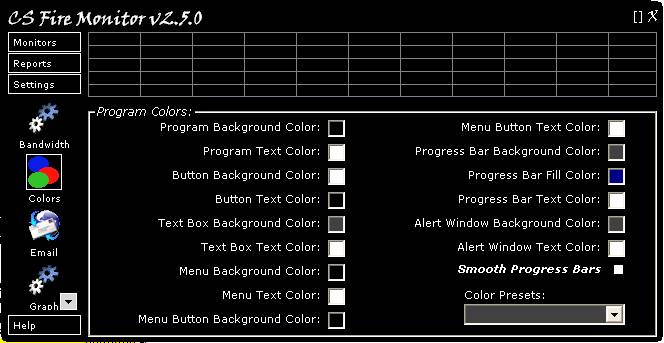
Figure 29 above shows the Colours Setting
screen. This screen allows the user to customise the CS Fire Monitor colour
scheme and is basically self explanatory. Colours can be changed by clicking in
the coloured square and selecting a colour from the Windows palette. The
“Smooth Progress Bars” tickbox removes the graduations from the progress bars
on various screens.
Figure
30
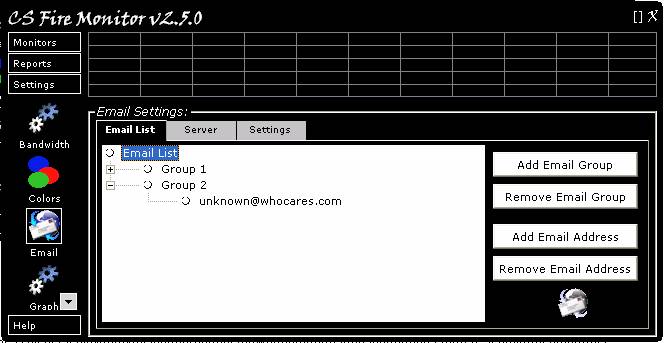
Figure 30 above shows the Email Settings
screen. There are three (3) tabbed screens; the first is called “Email List”
(shown in Figure 30), the second is called “Server” and the last is called
“Settings”.
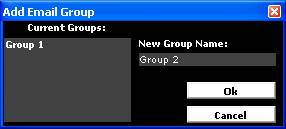
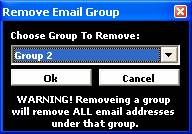
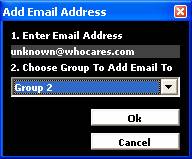
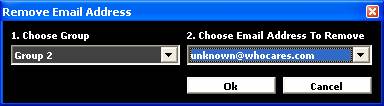
The “Email List”” tab allows the user to
set up email groups and add and remove email addresses from these groups. This
is achieved by using the buttons down the right hand side of the screen. Each
of these buttons opens one of the self explanatory subsidiary screens as shown
in Figure 31 below.
Figure
31
Clicking on the “Server” tab in the Email
Settings screen (Figure 30) opens the screen shown in Figure 32 below.
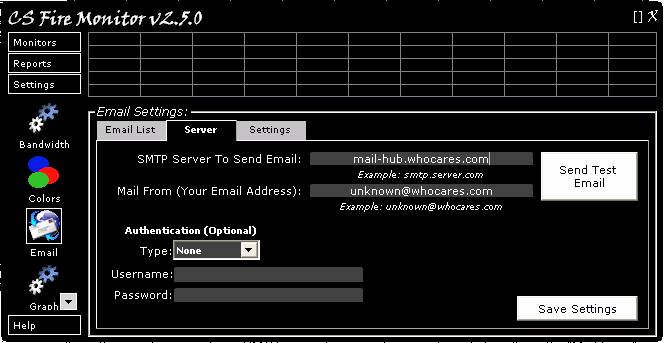
Figure
32
This screen allows the user to nominate an
SMTP server for originating emails and also allows the “Mail From” address to
be specified. Examples of the format required are shown under each of the top
two fields. If the SMTP server nominated requires authentication then the type of
authentication must be selected from the drop down list headed “Type” and the username
and password must be entered into the corresponding fields shown as “Username”
and “Password”. When you have made the appropriate entries click on “Save
Settings”.The radio buttons allow the user to select the email format; Plain
Text or HTML. The tick boxes at the bottom of the screen allow the user to firstly
include the PC name in the email subject line and secondly, the option to send
only one email to groups by including all email addresses within the group in
the BCC field of the one email.
Clicking on the “Settings” tab in the Email
Settings screen (Figure 30) opens the screen shown in Figure 33 below.
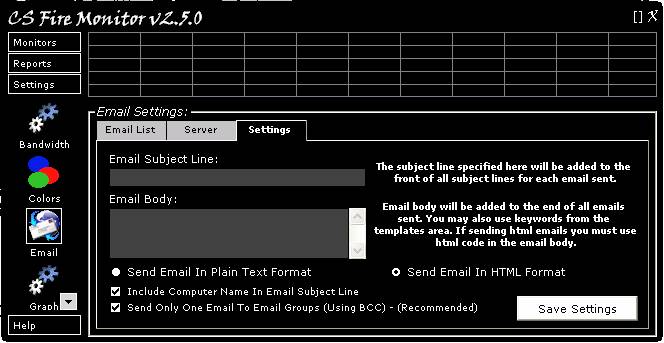
Figure
33
This screen allows the user to customise
the contents of all email subject lines by entering the desired text into the
“Email Subject Line” field. Additional text can be included in the body of the
email by entering the desired text into the “Email Body” field. The Email Body
text can include keywords that will replaced with the equivalent data when the
email is generated. The radio buttons allow the user to select the email
format; Plain Text or HTML. The tick boxes at the bottom of the screen allow
the user to firstly include the PC name in the email subject line and secondly,
the option to send only one email to groups by including all email addresses
within the group in the BCC field of the one email.
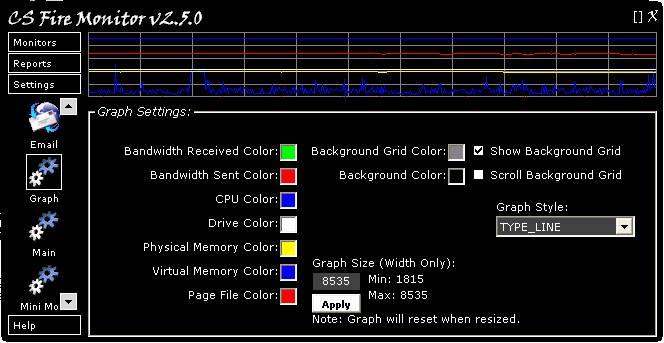
Figure
34
Figure 34 above shows the Graph Settings
screen. This screen allows the user to customise the CS Fire Monitor graph and
is basically self explanatory. Colours can be changed by clicking in the
coloured square and selecting a colour from the Windows palette. The graph
width can be adjusted between 1815 and 8535. The tickboxes allow the user to
turn on or off the background grid or the grid scrolling effect. The graph
style can be selected using the “Graph Style” drop down list.

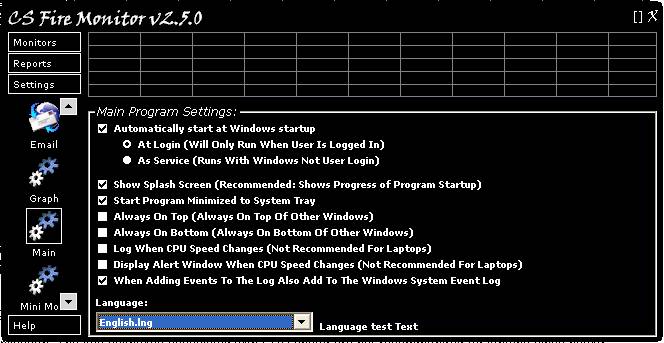
Figure
35
Figure 35 above shows the Main Settings
screen. Most of these switches are self explanatory. The radio buttons under
the first item allow the user to select whether CS Fire Monitor runs as a service
or as a logged in user application. The two tickboxes associated with CPU speed
are not recommended for laptops since the power management continuously changes
CPU speed to conserve battery power. The language used for text within CS Fire
Monitor can be set using the drop down box at the bottom of the screen.
Figure
36
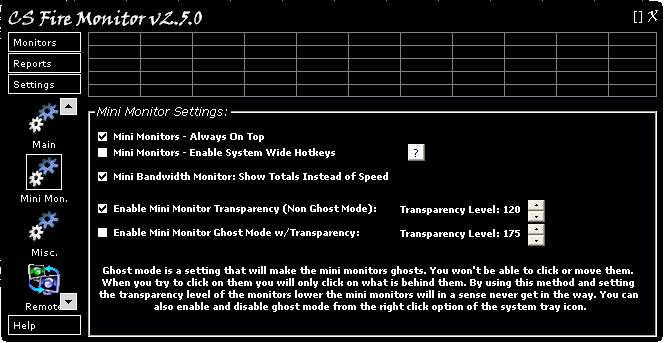
Figure 36 above shows the Mini Monitor
Settings screen. Mini Monitors can be turned on by right clicking the System
Tray icon and clicking “Mini Monitors”. The user is then presented with a
number of options as shown below:
-
Show All Mini Monitors
-
Hide All Mini Monitors
-
Enable Ghost Mode
-
Reapply Topmost Attributes
-
Bandwidth Mini Monitor >Show/Hide
-
CPU Mini Monitor >Show/Hide
-
CPU Speed Min Monitor >Show/Hide
-
Memory Mini Monitor >Show/Hide
Selected Mini Monitors can be moved around
the screen to any convenient location. In addition, Mini Monitors can be made
partially transparent (Transparent Mode) but still movable by dragging or they
can be made ghosts (Ghost Mode with Transparent Mode) such that the user can
“click through” the Mini Monitor to the underlying application window. When in Ghost
Mode the Mini Monitor cannot be dragged around the screen; Ghost Mode must be
turned off before the Mini Monitors can be moved.
The first tickbox on the Mini Monitor
Settings screen (Figure 36) is a fairly standard option to enable the Mini
Monitors to always be on top of other application windows. When using this setting,
the topmost attribute is occasionally lost and, without Ghost Mode enabled, the
attribute can be retained by simply clicking on it. However, if Ghost Mode is
enabled, then clicking on it will not work and hence the “Reapply Topmost
Attributes” option in the Mini Monitors menu found by right clicking the icon
in the System Tray and selecting “Mini Monitors”.
The second tickbox is to enable the system
wide hotkeys that are detailed on a subsidiary screen found by clicking on the
question mark button found alongside this option. The third tickbox allows the
user to select whether the bandwidth Mini Monitor shows Data Sent and Received
data volumes rather than Data Sent and Received speeds. The
fourth tickbox enables Transparency Mode for the Mini Monitors and allows the
transparency level to be set. The fifth tickbox enables Ghost Mode (with
Transparency Mode) for the Mini Monitors and allows the transparency level to
be set.
Figure
37
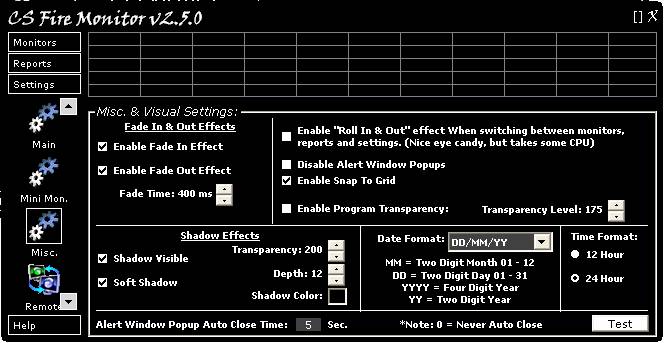
Figure 37 above shows the Misc. Settings
screen. The first group of tickboxes entitled “Fade In & Out Effects” at
the top left of this screen enable fade in and out of the main program screen.
The fade time can be adjusted. The group below that entitled “Shadow Effects”
enables shadow for the main program screen. Transparency, depth and colour of
the shadow can also be set. The last item on the left hand side sets the visible
time for the Alert Window Popup and allows you to test the effect by clicking
on the “Test” button.
The tickboxes in the top right hand corner
of the screen are a miscellaneous group of options that are basically self
explanatory. Try clicking the “Roll In & Out” effect tickbox and see what
happens when you try navigating between items within the Settings group. The
“Disable Alert Window Popups tickbox does exactly as it states. This option can
also be set by right clicking the CS Fire Monitor System Tray Icon and
selecting “Disable Alert Popups”. The “Enable Snap To Grid” tickbox makes alignment
of the Mini Monitors easier. The “Enable Program Transparency” tickbox allows
the main program screen to be transparent with the level set by the up and down
arrows to the right. The “Date Format” drop down list and the “Time Format”
radio buttons allow the user to select their favourite date and time formats to
be used throughout CS Fire Monitor.
Figure
38
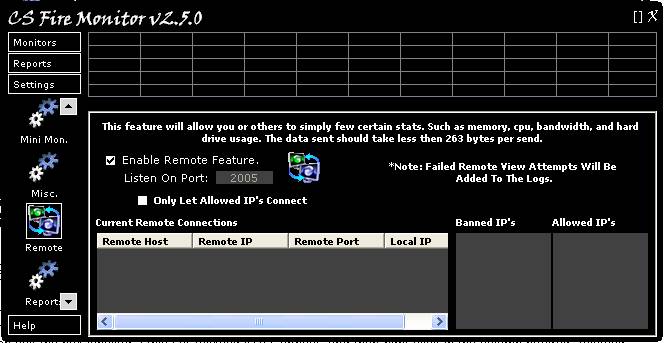
Figure 38 above shows the Remote Settings
screen. This screen can also be accessed by right clicking the CS Fire Monitor
icon in the System Tray and then clicking on “Remote View Settings”. The first
tickbox in the screen enables the remote feature and allows others to use the CS
Fire Monitor Remote Viewer to access this PC to obtain certain statistics.
Details of any connection currently accessing this PC would be listed in the
table at the bottom left hand corner of the screen. If the user only wants
certain IP addresses to access using this function then tick the box labelled
“Only Let Allowed IP’s Connect” and then right click in the column headed “Allowed
IP’s” and enter the appropriate IP address(es). If the user just wants to ban
certain IP addresses from using this function then untick the box labelled
“Only Let Allowed IP’s Connect” and then right click in the column headed
“Banned IP’s” and enter the appropriate IP address(es).
The CS Fire Monitor Remote Viewer will be
described later in more detail under its own heading.
Figure
39
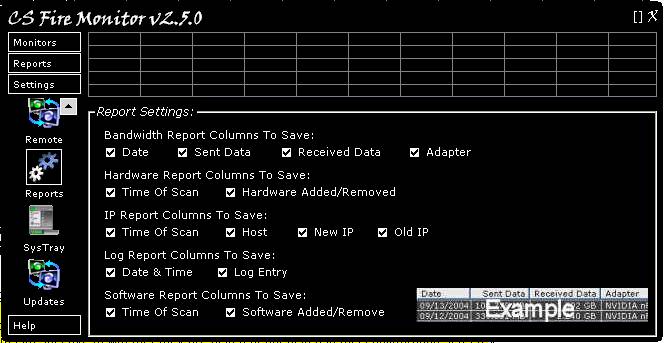
Figure 39 above shows the Report Settings
screen. This is a simple configuration screen that allows the user to select
which items of information should be written to the Reports. This applies to
the Reports within CS Fire Monitor and those saved or auto saved to file using
templates. The CS Fire Monitor database stores all these items irrespective of whether
they are ticked or not ticked in this configuration screen.
Figure
40
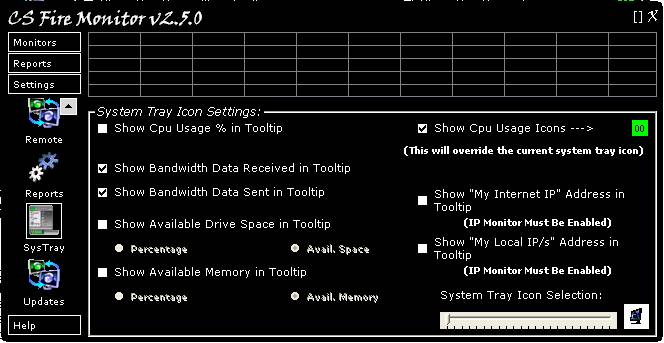
Figure 40 above shows the System Tray Icon
Settings screen. If the top tickbox on the right hand side labelled “Show CPU
Usage Icons” is unticked, the CS Fire Monitor System Tray Icon can be selected
using the slider at the bottom right hand corner of the screen. There are 22
possible CS Fire Monitor icons to choose from. Ticking the top tickbox on the
right hand side labelled “Show CPU Usage Icons” replaces the selected icon with
a green rectangular icon containing the CPU occupancy in percent. The rectangular
icon changes colour to orange when CPU occupancy exceeds 90% and changes to red
when CPU occupancy exceeds 95%.
If the cursor is placed over the CS Fire
Monitor System Tray icon a Tooltip comes up that can show a variety of
information. The remaining options in the System Tray Icon Settings can be
selected or not depending on what information is required to be shown in this
Tooltip.
About
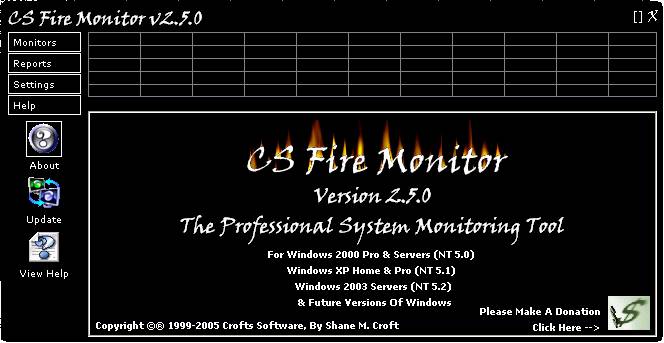
Figure
42
Figure 42 above shows the “About” screen
which is basically the same as the initial welcome screen. This screen shows
the current version of CS Fire Monitor.
The System Tray Menu is accessed by right
clicking the CS Fire Monitor System Tray Icon. The user is then presented with
a number of options as shown below:
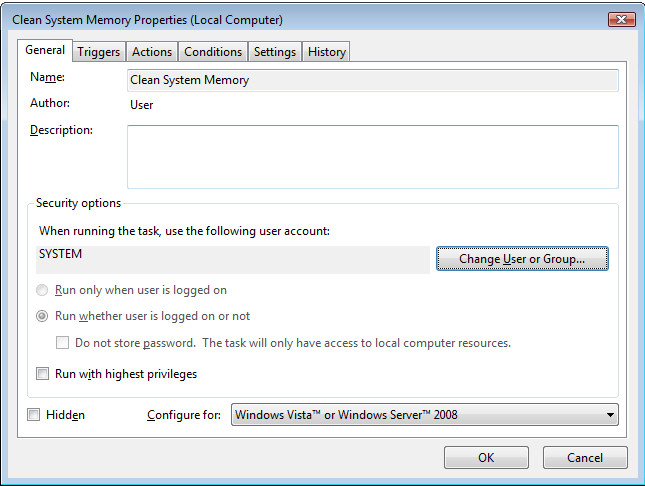
o
Clean System Memory (Takes 5 Sec.) Cleans
System Memory
o
Copy “My Internet IP” To Clipboard Does
as it states
o
Copy “My Local IP(s) To Clipboard Does
as it states
o
Send Email – “My Internet IP” Does as it states, Uses The Tasks
Monitor Settings
o
Send Email – “My Local IP(s) Does
as it states, Uses The Tasks Monitor Settings
-
Mini Monitors Already
discussed under Mini Monitor Settings
-
Disable Alert Popups Already
discussed under Misc. Settings
-
Donate By PayPal Thanks
very much!
-
Exit & Close Program Exits
and closes CS Fire Monitor
CS Fire Monitor Remote Viewer, once
installed, can be opened by either of the following methods:
If the Remote Viewer senses that there is
Multiple IPs available it will show the screen in Figure 43 below.
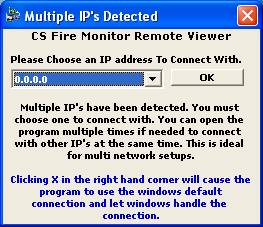
Figure
43
The user can either select one of the IP
addresses in the drop down list and click “OK” or just close the window with
the X in the top right hand corner and the Remote Viewer will use the
Windows default connection. The screen in Figure 44 below should then come up.
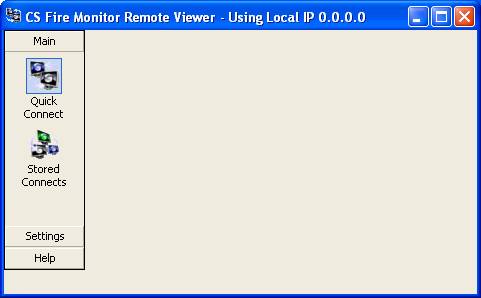
Figure
44
The user can then click on the “Quick
Connect” icon under the “Main” heading in the navigation bar on the left hand
side to get the screen shown in Figure 45 below.
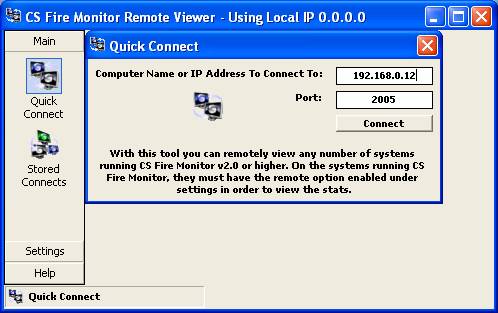
Figure
45
Enter the IP address of the PC to be monitored
and click on “Connect”. The next screen that comes up should look something
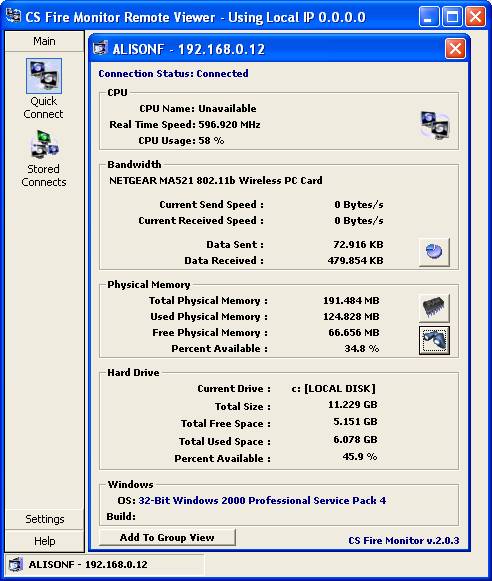
like the one in Figure 46 below.
Figure
46
Most of the information shown on the subsidiary
screen labelled “ALISONF – 192.168.0.12” in Figure 46 is self explanatory.
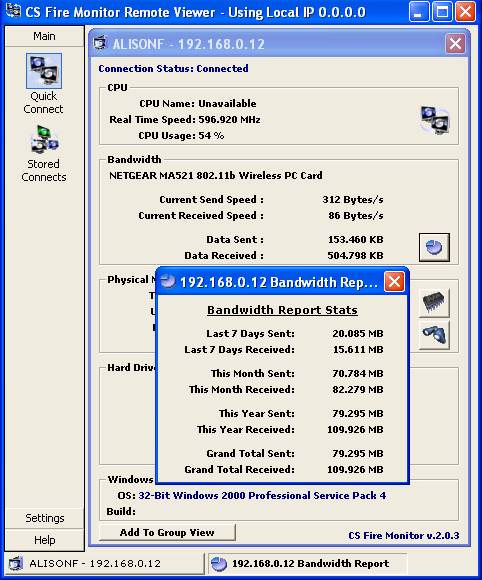
Clicking on the “Show Bandwidth Totals From Bandwidth Reports” button (picture
of a pie-chart) at the bottom right hand corner of the section titled
“Bandwidth” provides the additional superimposed screen of information shown in
Figure 47 below.
Figure
47
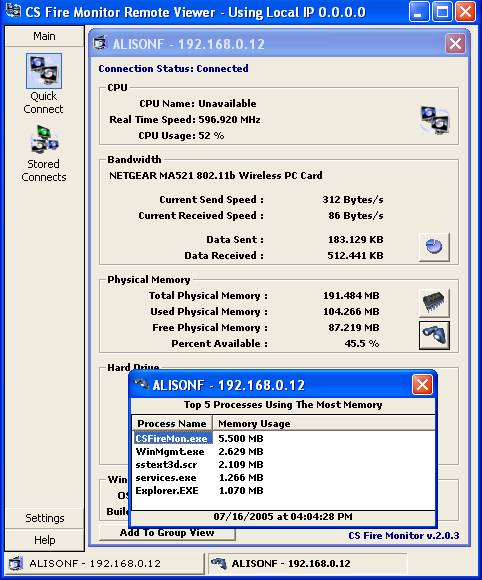
There are two more buttons in the “Physical
Memory” section of the subsidiary screen in Figure 46. The first of these looks
like a picture of an Integrated Circuit and is the “Clean System Memory” button;
an action that takes approximately 5 seconds. The second button in the
“Physical Memory” section, with a picture of binoculars on it, is the “List Top
5 Memory Using Processes” button. Clicking this button gives the additional superimposed
screen shown in Figure 48 below.
Figure
48
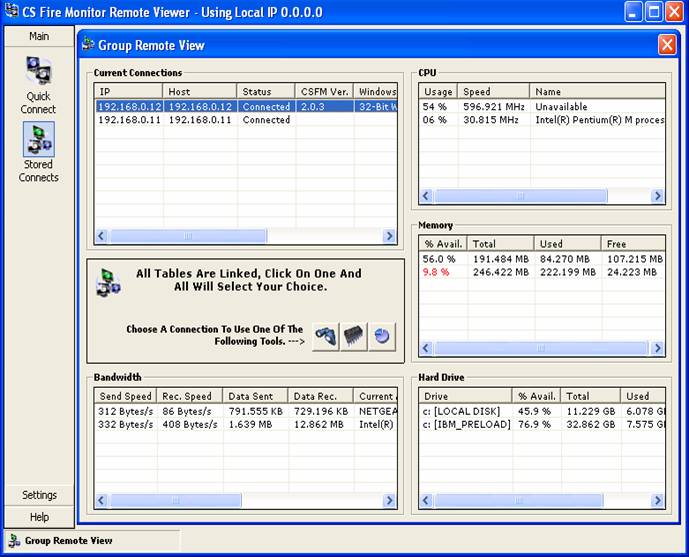
At the bottom of the screen shown in Figure
46 there is a button labelled “Add To Group View”. Clicking on this button adds
the PC the user is currently monitoring to a “Group Remote View” screen as
shown in Figure 49 below. This feature allows the user to monitor a number of PCs
from the same screen. An individual PC can be selected by highlighting and then
the buttons for Bandwidth Information, Clean System Memory and Top 5 Processes
can be used from the Group Remote View screen for that particular PC.
Figure
49
Instead of using the using the “Quick
Connect” screen as in Figure 45, the user can also connect to a remote PC by
clicking on the “Stored Connects” icon under the “Main” heading in the
navigation bar of the screen in Figure 44. This opens the screen as shown in
Figure 50 below.
Figure
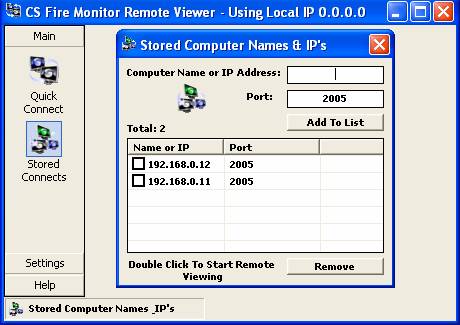
50
To connect to an already stored computer IP
address it is only necessary to double click the IP address shown in the “Stored
Computer Names & IP’s” table. Additional IP addresses can be added to this
table by entering the IP address in the field at the top right hand corner of
the “Stored Computer Names & IP’s” screen and then clicking on “Add To
List”. Unwanted IP addresses in the list can be removed by highlighting the IP
address and then clicking on the “Remove” button at the bottom right hand
corner of the screen.
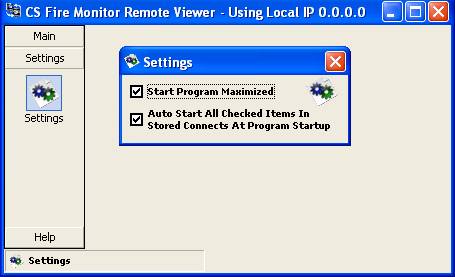
If the user wants to automatically open
connections to certain PCs when CS Fire Monitor Remote Viewer is started then
it is necessary to go into “Settings” screen from the navigation bar in Figure
44 and tick the item “Auto Start All Checked Items in Stored Connects At Program
Startup” (see Figure 51 below). Then in the “Stored Computer Names & IP’s”
screen shown in Figure 50 tick the boxes next to the IP address(es) for those PCs
that the user wishes to automatically connect to when opening CS Fire Monitor
Remote Viewer.
Figure
51
The “Start Program Maximised” option in the
“Settings” screen shown in Figure 51 is self explanatory.
The “Help” icon in the navigation bar of
the CS Fire Monitor Remote Viewer” screen in Figure 44 contains an “About” icon
that opens a screen to show the version number of the CS Fire Monitor Remote
Viewer.
The CS Fire Monitor can be used as a Windows
screen saver. To set this up the user needs to go into the Windows “Display
Properties” in the usual way and then find “Csfiremon” in the Screen Saver drop
down list and select it. Note that CS Fire Monitor program must be running for
the screen saver to get the necessary data.
CS Fire Monitor V 1.6.1 and later can be
started as a service. If CS Fire Monitor is running as a service the user can
change the default logon screen saver to the CS Fire Monitor screen saver using
this easy method from Microsoft:
http://support.microsoft.com/kb/314493
Appendix
##currentversion##
##autoupdatenabled##
##autoupdatelastchecked##
##autoupdatenextcheck##
##smtpserver##
##templatecreationtime##
##templateinterval##
##templatenextcreationtime##
##bandwidthselectedconnection##
##bandwidthselectedconnectiontype##
##bandwidthselectedcurrentsendspeed##
##bandwidthselectedcurrentreceivedspeed##
##bandwidthselecteddatasent##
##bandwidthselecteddatareceived##
##bandwidthselectedinterfacedescription##
##bandwidthselectedinterfacetype##
##bandwidthselectedinterfacespeed##
##bandwidthselectedphysicaladdress##
##bandwidthselectedadminstatus##
##bandwidthselectedoperationalstatus##
##cpuusage##
##cpuspeed##
##cpurealtimespeed##
##cpuvendorid##
##cpumanufacturer##
##cpuname##
##cputype##
##cpufamily##
##cpumodel##
##cpubrand##
##cpustepping##
##cpulogical##
##cpuapicid##
##cpuserialnumber##
##driveletter##
##drivesize##
##drivetotalfreespace##
##driveavailablefreespace##
##driveusedspace##
##drivepercent##
##drivenumberofdrives##
##drivecombinedsize##
##ipmyinternetiplastip##
##ipmyinternetipcurrentip##
##ipmyinternetipinterval##
##ipmyinternetiplastchecked##
##iplocaliplastip##
##iplocalipcurrentip##
##iplocalipinterval##
##iplocaliplastchecked##
##memorytotal##
##memoryused##
##memoryfree##
##memorypercent##
##memorytotalvirtual##
##memoryusedvirtual##
##memoryfreevirtual##
##memorypercentvirtual##
##memorymaxpagefile##
##memoryusedpagefile##
##memoryfreepagefile##
##memorypercentpagefile##
##bandwidthreport##
##hardwareinstalledreport##
##hardwareremovedreport##
##ipreport##
##logreport##
##softwareinstalledreport##
##softwareremovedreport##